
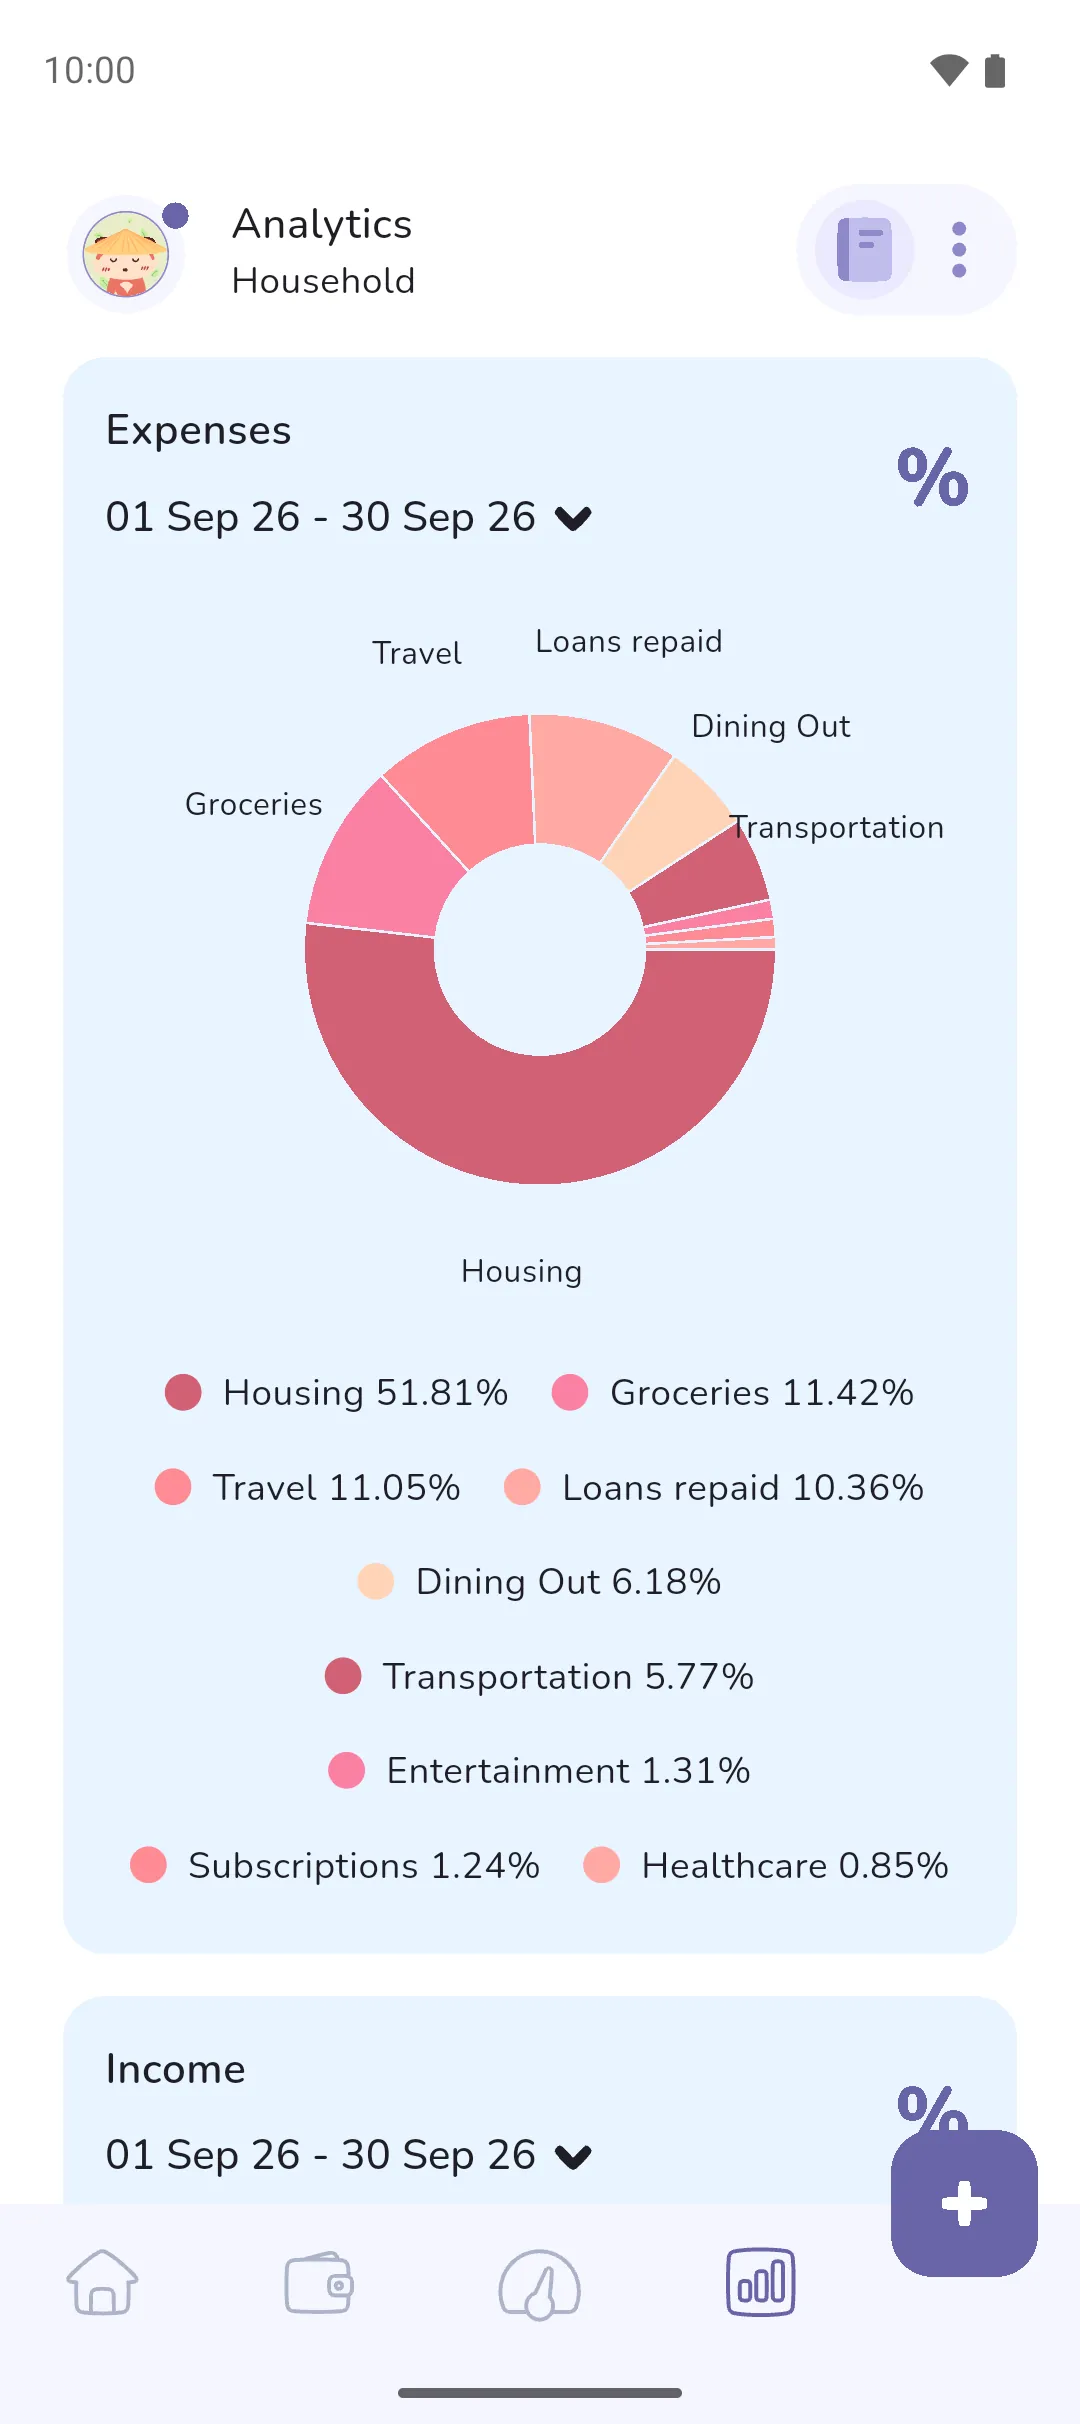
Analytics shows where the active book's money went over its last six periods, in charts and tables. It answers whether you end each period up or down, and what takes the biggest share of your expenses.
Where to find it: the Analytics tab (Analytics tab icon, fourth in the bottom bar).
 Analytics tab icon, fourth in the bottom bar).
This period
The first two cards, Expenses and Income, are pie charts of this period by category, with the period's dates beneath the title. Each slice is a category's share of the period's settled total, largest first, and the chart reads No data while the period has nothing settled. The icon beside a card's title shows the view you're in. Tap the Percentage icon to swap the legend for a table of percentages and amounts with a Total row, and the List icon to swap it back. Tap the dates, or the Expand icon beside them, to pick another period: a month in a monthly book, a week or fortnight otherwise.
 Percentage icon to swap the legend for a table of percentages and amounts with a Total row, and the
  List icon to swap it back. Tap the dates, or the
  Expand icon beside them, to pick another period: a month in a monthly book, a week or fortnight otherwise.
Top expense categories lists the three categories you spent most on in each of the last six periods. Top income categories does the same for income but requires Pro.
The last six periods
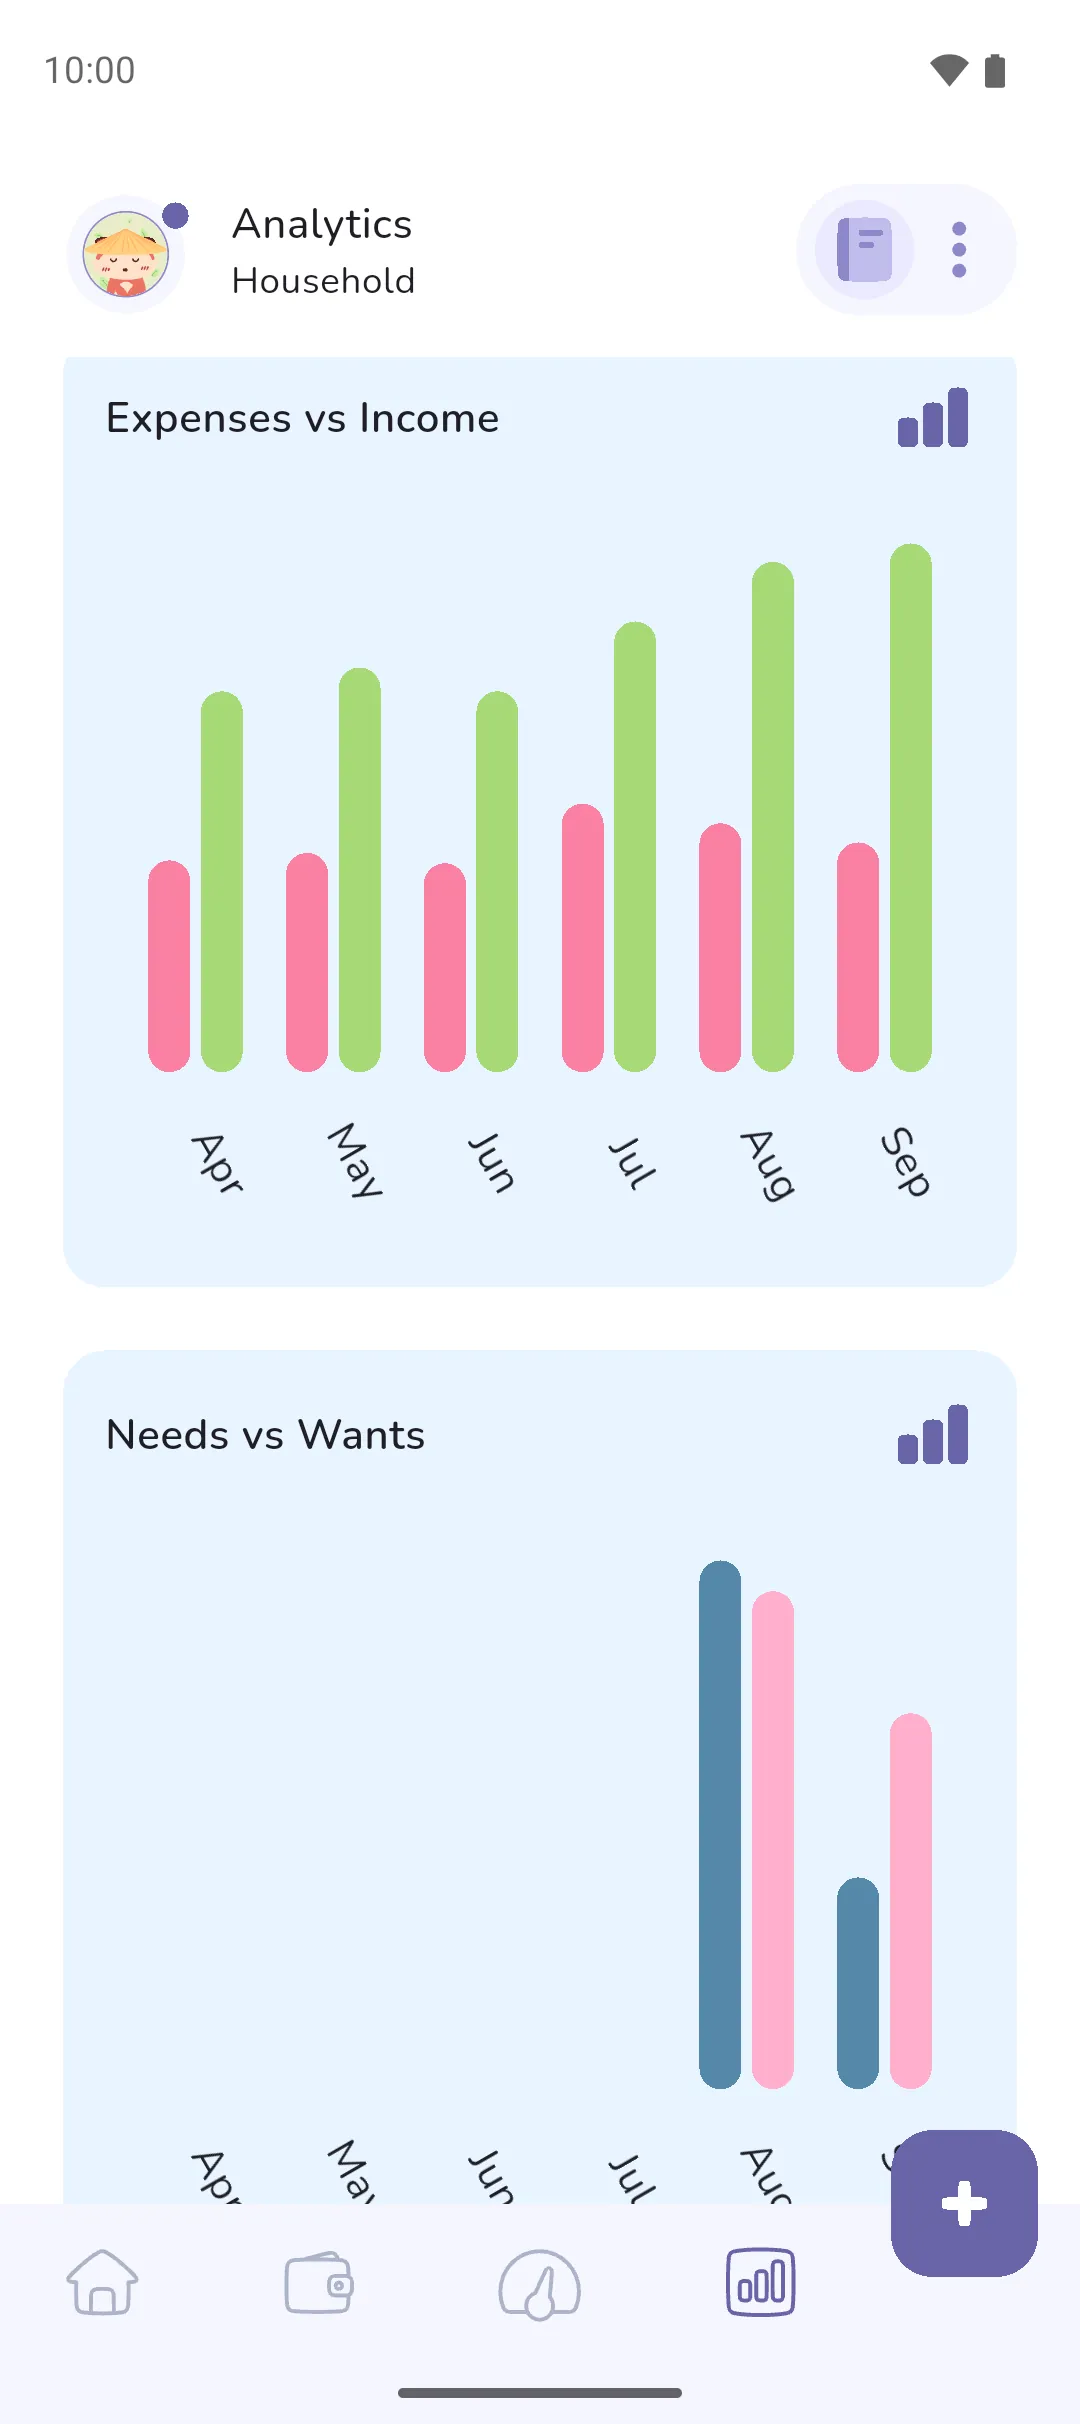
Every card below runs over the same six periods, oldest on the left, with the current period counted up to today. A period before your first transaction shows zero. A monthly book labels each period by its month, a weekly or fortnightly book by the date it starts.
- Expenses vs Income pairs a bar for settled expenses with a bar for settled income in each period. Tap and hold a pair for its figures. Tap the Bar chart icon for a table, where expenses read as negative figures, and the List icon to go back.
- Budget vs Actual plots your overall budget for each period against what you spent. It shows once one of the six periods has an overall budget. Tap and hold a point for its figures. Goal vs Actual does the same for your overall goal against income, once a period has a goal, but requires Pro.
- Cash flow is a line of what each period ended up or down by, settled income minus settled expenses, dipping below zero where you overspent. Pro is required. Tap the Line chart icon for a table and the List icon to go back.
 Bar chart icon for a table, where expenses read as negative figures, and the
  Line chart icon for a table and the
 The app remembers the chart or table choice on each card.
With Pro Sync: a Needs vs Wants card, after Expenses vs Income, pairs what you sorted as a need with what you sorted as a want in each period. Sorting happens in the review queue: see Reviewing transactions.
Averages and totals
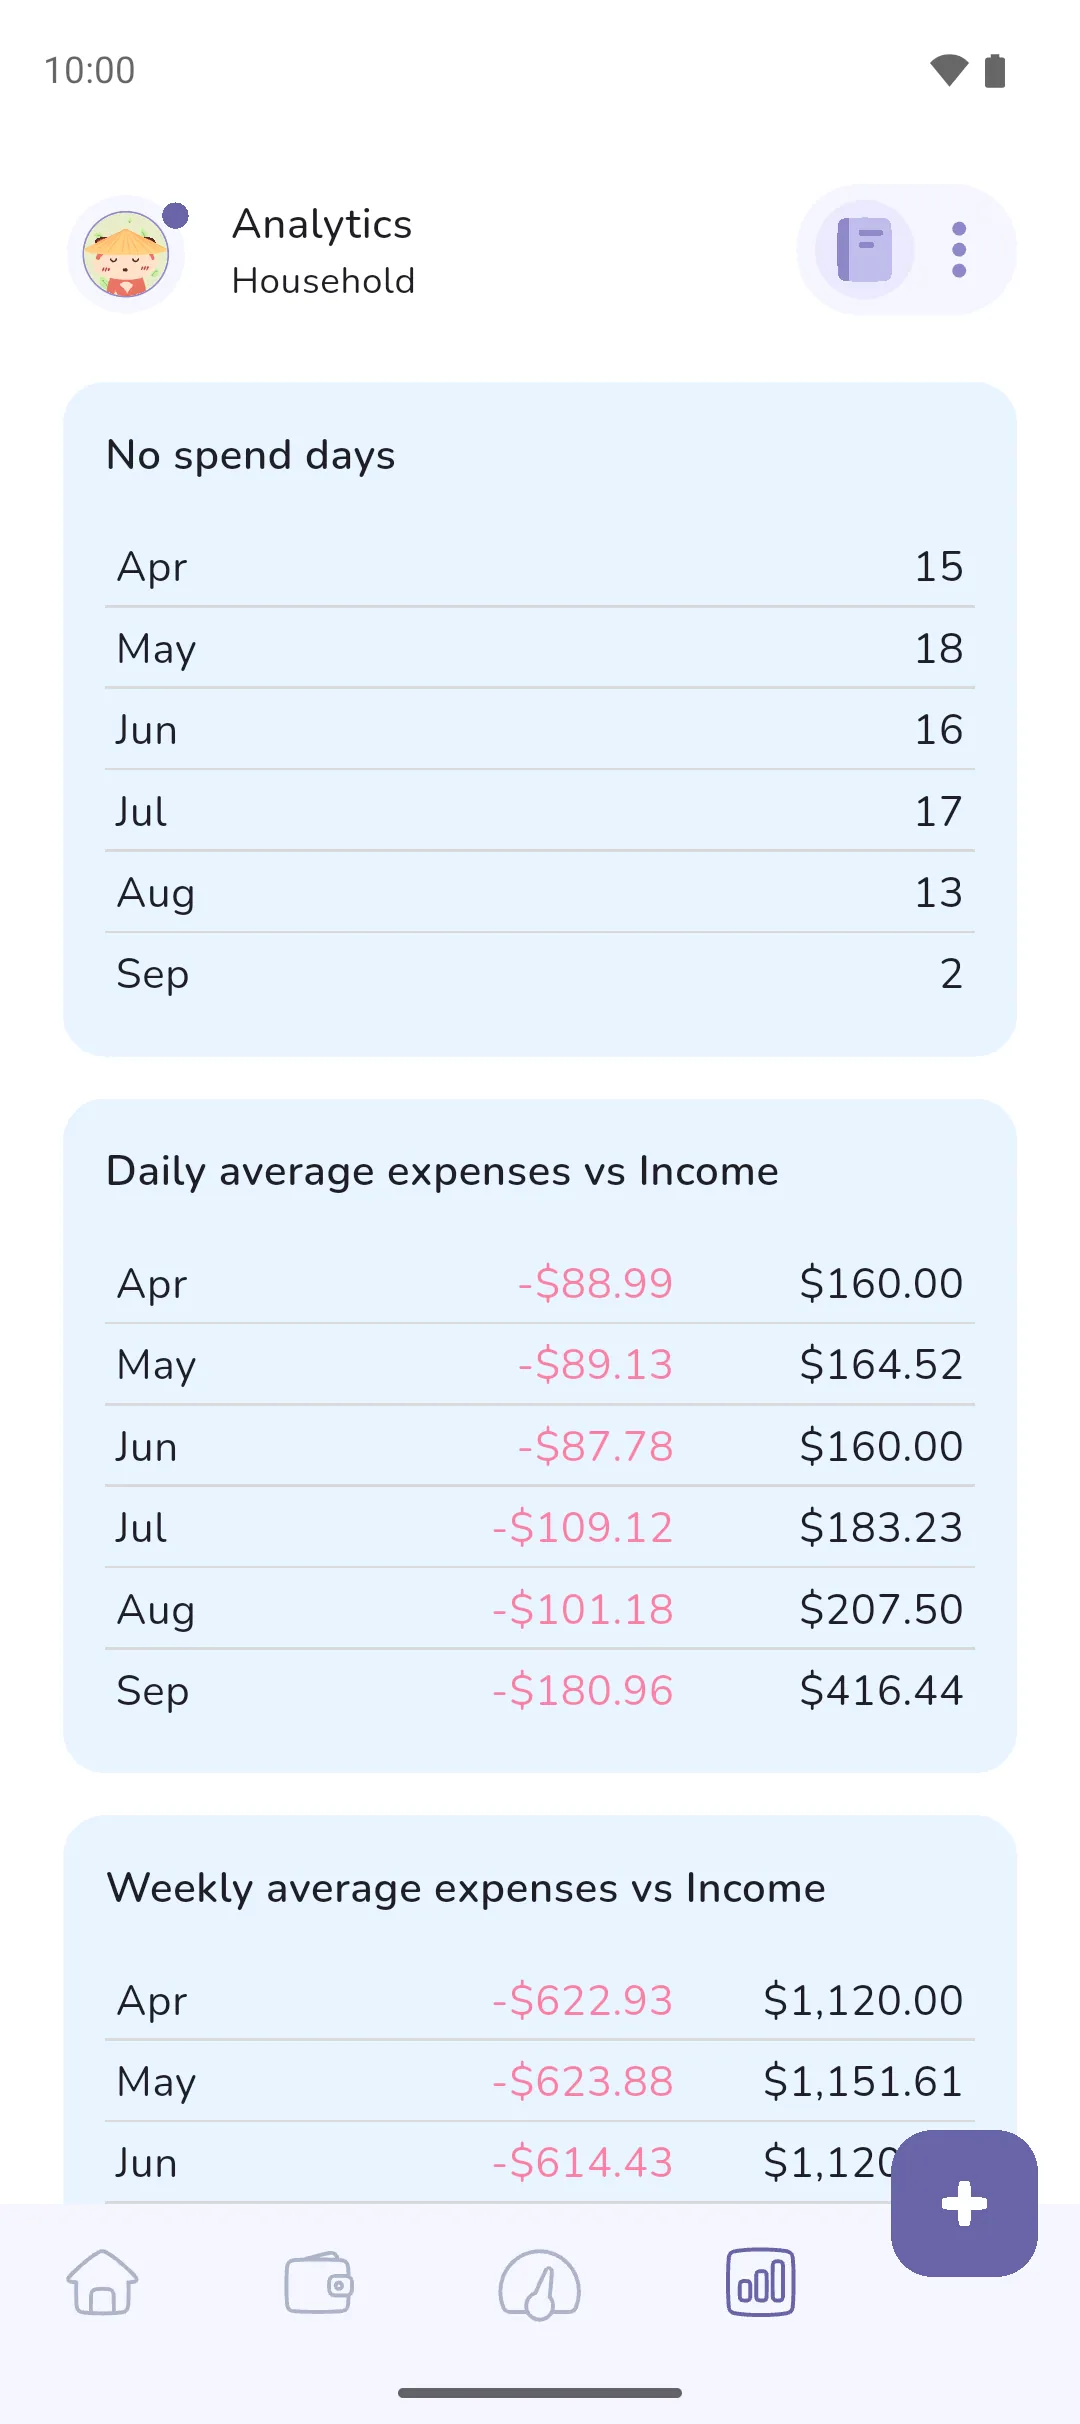
Pro is required for these cards.
- No spend days counts the days in each period with no settled expense, the current period up to yesterday. A savings tracker's Fees charged entry doesn't spoil a day.
- Daily average expenses vs Income divides each period's settled expenses and income by its days. Weekly average expenses vs Income does the same by weeks.
- Monthly average, in a monthly book only, is the average settled expenses and income per calendar month over the months named beneath the title.
- Year-to-date totals is settled income minus settled expenses since 1 January, with both figures beneath. Tap the Calendar icon to break both down by category, and the Categories icon to go back.
- Total balance is the book's total today, every account and any tracker set to count in it, with all your settled income and expenses beneath.
 Calendar icon to break both down by category, and the
  Categories icon to go back.
- Every figure here counts settled money only, so a category with only pending transactions this period stays out of the pie chart until one settles. See Pending and settled.
- Expenses and income are the transactions on your everyday accounts and savings trackers. A loan repayment counts as an expense under Loans repaid, and money borrowed as income under Borrowed funds. A loan's interest and fees stay out of the charts and averages, as does a transfer between accounts or into savings, since neither is an expense.
- Budget vs Actual sets every settled expense against your overall budget, including expenses in a category with Include in overall budget unticked, so a period the home screen called under budget can read over here.
- Hide income, under Settings → Privacy, hides the Income chart, Top income categories and Goal vs Actual, and Expenses vs Income shows Hidden in place of each income figure. The averages and totals keep their income figures.
- On the Analytics tab, pull down to sync your data.
See also: Budgets and goals, Categories, Trackers, Pending and settled, Calendar and timeline.